
The Art of Data Visualization: Exploring D3.js
Data is everywhere, flowing into our applications from various sources at an unprecedented rate. However, raw data alone holds little value unless it can be transformed into meaningful insights.
This is where the art of data visualization shines, transforming complex datasets into captivating visual narratives. In this article, we’re going to explore a popular JavaScript library, D3.js.
What is D3.js?
D3, short for Data-Driven Documents, is a JavaScript library that empowers developers to create dynamic and interactive data visualizations directly within web browsers. It is renowned for its ability to create stunning, interactive data visualizations.
This library is built around the concept of data binding. This means linking data to elements in a document, such as HTML or SVG elements, and then dynamically updating those elements to reflect changes in the underlying data.
By doing so, D3 enables the creation of data-driven visualizations that respond to user interactions and changes in data. D3 also provides powerful utilities for working with data, including functions for data loading, parsing, filtering, and aggregation, of which we’ll be exploring below. These utilities enable us to handle diverse data sources and formats, making it a tad bit easier to integrate external data into visualizations.
So in short, D3 is a powerful tool that allows us to transform data into captivating and meaningful visual narratives.
Fundamentals of D3.js
So far, we’ve defined what D3.js actually is. We should explore the fundamentals a bit before actually diving into an example – we’ll save that for last.
Data Binding: The Backbone of D3.js
At the heart of D3 lies the concept of data binding, which is a general technique that binds data sources from the provider and consumer together and synchronizes them. This foundational principle allows developers to seamlessly link data to elements in a document, such as HTML or SVG entities.
By establishing this connection, D3 enables the automatic updating of visual elements in response to changes in the underlying data.
This relationship between data and visualization forms the backbone of D3.js, allowing us to create fluid and responsive visualizations that adapt to real-time data streams and user interactions.
Using Scalable Vector Graphics (SVG)
D3.js leverages the capabilities of Scalable Vector Graphics (SVG) to create high-quality and scalable visualizations directly within web browsers. SVG provides a rich set of graphical elements, including shapes, paths, and text, that serve as the building blocks for creating intricate and dynamic visualizations.
With D3.js, developers have the freedom to manipulate these SVG elements programmatically, allowing for the creation of a diverse range of visualizations, from simple charts to complex data-driven diagrams.
Data Manipulation with D3.js Utilities
In addition to data binding and SVG manipulation, D3.js provides a comprehensive suite of utilities for working with data. These utilities include functions for loading, parsing, filtering, and aggregating data, making it easier for developers to handle diverse data sources and formats.
Whether working with static datasets or streaming real-time data, D3.js equips developers with the tools necessary to navigate the complexities of data manipulation with ease and efficiency.
Let’s examine these utility functions.
First, let’s look at loading data in D3.js. Loading data in D3.js involves fetching external data files, such as CSV, JSON, or TSV files, and making them available for use within the visualization.
💡 The code below isn’t going to work as a local file. You’ll need to start a server. You can spin up a Node.js server, or simply install the http-server package via npm by running npm i -g http-server, and then simply running http-server in the d3 directory.
Loading data with D3.js
If we have a CSV file, we can load it like so:
d3.csv('data.csv')
  .then((data) => {
    console.log(data);
  })
  .catch((error) => {
    console.error("Error loading data: ", error);
  });
d3.csv() is used to load data from a CSV file named “data.csv”. The .then() function is used to handle the successful loading of data, which we simply log it to the console in this example. .catch() is used for error handling.
If you want to follow along, create a folder named d3 (or whatever you’d like), create an index.html file, and paste the following:
<!DOCTYPE html>
<html lang="en">
  <head>
    <meta charset="UTF-8" />
    <meta name="viewport" content="width=device-width, initial-scale=1.0" />
    <title>Data Visualization with D3.js</title>
    <script
      src="https://cdnjs.cloudflare.com/ajax/libs/d3/7.9.0/d3.min.js"
      integrity="sha512-vc58qvvBdrDR4etbxMdlTt4GBQk1qjvyORR2nrsPsFPyrs+/u5c3+1Ct6upOgdZoIl7eq6k3a1UPDSNAQi/32A=="
      crossorigin="anonymous"
      referrerpolicy="no-referrer"
    ></script>
  </head>
  <body>
    <svg width="600" height="400"></svg>
    <script>
      d3.csv('data.csv')
        .then((data) => {
          console.log(data);
        })
        .catch((error) => {
          console.error("Error loading data: ", error);
        });
    </script>
  </body>
</html>
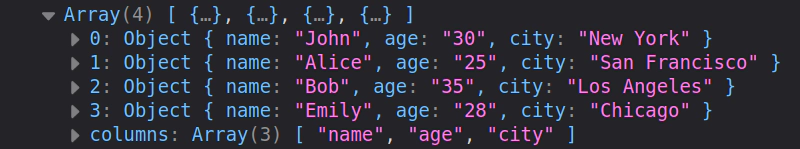
You’ll also want to create the data.csv file. You can paste the following into the file, just for testing purposes:
name,age,city
John,30,New York
Alice,25,San Francisco
Bob,35,Los Angeles
Emily,28,Chicago
We should see something like this in the console:
Parsing Data with D3.js
Parsing data involves transforming raw data from its original format into a structured format that is suitable for visualization. This often includes converting strings to numbers, dates, or other data types.
To see how this is done, let’s begin with a CSV file with the following content:
date,value
2022-01-01,10
2022-01-02,15
2022-01-03,20
2022-01-04,25
2022-01-05,30
As you can see, we have a list of dates with columns date and value.
Next, let’s parse each row of data using D3:
d3.csv('date.csv', d => {
  return {
    date: new Date(d.date),
    value: +d.value,
  };
})
  .then(data => {
    console.log(data);
  })
  .catch(error => {
    console.error("Error parsing data: ", error);
  });
Please note that you can use the above HTML as a template for this script, just remember to include another CSV file called date.csv.
Opening up dates.html and checking the console, you should see this:
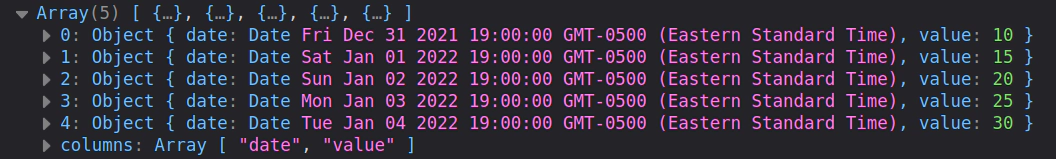
Circling back on what was said above, the callback passed to d3.csv is used to parse each row of data from the CSV file. It converts the date field from a string to a Date object. Likewise, it converts the value field from a string to a number.
Filtering Data with D3.js
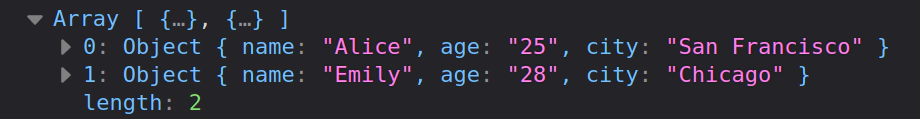
For this section, we can use the CSV file we already created, data.csv. Filtering data involves selecting a subset of data that meets specific criteria, such as filtering based on values, categories, or dates.
d3.csv('data.csv').then((data) => {
    const filteredData = data.filter((d) => {
        return d.age < 30;
    });

    console.log(filteredData);
}).catch((error) => {
    console.error("Error loading data: ", error);
});
As you might recall, there were two people younger than the age of 30 in the CSV file. We can see that in the console when we navigate to filter.html:
Aggregating Data
Aggregating data involves grouping data together based on common attributes or criteria and then performing calculations or summarizations on each group.
For this section, let’s create a new CSV file called aggregated_data.csv, or whatever you’d like, really. In this file, paste the following text:
category,value
A,10
B,15
A,20
C,25
B,30
As you might already realize, these items are essentially going to be “grouped by”, and condensed together. Before looking on further, take a look at the CSV file and try to guess what you are going to see printed in the console.
d3.csv('aggregated_data.csv').then((data) => {
    const aggregatedData = d3.group(data, d => d.category);

    // Calculate sum of values for each category
    const sumByCategory = new Map();
    aggregatedData.forEach((value, key) => {
        const sum = d3.sum(value, d => d.value);
        sumByCategory.set(key, sum);
    });

    console.log(sumByCategory);
}).catch((error) => {
    console.error("Error loading data: ", error);
});
Checking the console in aggregate.html, we should see some neat little code:
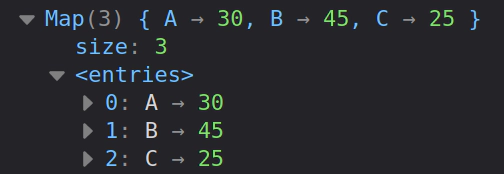
If you got it right, give yourself a pat on the back.
So, these examples demonstrate the fundamental concepts of loading, parsing, filtering, and aggregating data in D3.js, which are essential for preparing and manipulating data for visualization purposes.
Creating a Bitcoin Graph with D3.js
💡 For this little project, we don’t need to run the http-server command, we can just open the HTML file in the browser.
Let’s create a line chart using D3.js to display bitcoin prices over time. To do this, we’ll use an API. Specifically, we’ll use the coingecko API.
This page is going to require a few more lines of code than the previous examples. So, let’s start with a fresh HTML skeleton:
<!DOCTYPE html>
<html lang="en">
<head>
  <meta charset="UTF-8">
  <meta name="viewport" content="width=device-width, initial-scale=1.0">
  <title>Bitcoin Chart</title>
  <script
    src="https://cdnjs.cloudflare.com/ajax/libs/d3/7.9.0/d3.min.js"
    integrity="sha512-vc58qvvBdrDR4etbxMdlTt4GBQk1qjvyORR2nrsPsFPyrs+/u5c3+1Ct6upOgdZoIl7eq6k3a1UPDSNAQi/32A=="
    crossorigin="anonymous"
    referrerpolicy="no-referrer"
  ></script>
</head>
<body style="text-align: center;">
  <svg width="600" height="400"></svg>

  <script>

  </script>

</body>
</html>
As you probably already know, we’ll be placing our code within the <script></script> tags. But take a moment to examine the HTML code above. There’s a new element being introduced, which is the <svg> tag. We mentioned earlier in the article that D3.js leverages the capabilities of SVG. Well, there you have it – the <svg> tag is going to serve as the building block for our chart.
Well, I suppose we should start building the graph. The first thing we’ll probably want to do is set up a function to fetch data from the API.
async function fetchData() {
    const response = await fetch('https://api.coingecko.com/api/v3/coins/bitcoin/market_chart?vs_currency=usd&days=30');
    const data = await response.json();

    return data.prices.map(([timestamp, price]) => ({ date: new Date(timestamp), price }));
}
Now we have a function, fetchData() defined. The return statement might look a bit confusing, but it’s just returning a mapped array based on the data.prices array. We can test this out right now. Open up the console and paste the function. Then run console.log(fetchData()). You should see the data returned in the console.
Next we’ll get into the fun part – actually creating the chart. For this, we’ll declare a function, drawChart(). Within the drawChart() function, we’ll be making use of a lot of D3 methods, so bear with us.
async function drawChart() {
    const data = await fetchData();

    const margin = { top: 20, right: 30, bottom: 30, left: 50 };
    const width = 900 - margin.left - margin.right;
    const height = 400 - margin.top - margin.bottom;

    const svg = d3.select('svg')
        .attr('width', width + margin.left + margin.right)
        .attr('height', height + margin.top + margin.bottom)
        .append('g')
        .attr('transform', `translate(${margin.left}, ${margin.top})`);

    const x = d3.scaleUtc()
        .domain(d3.extent(data, d => d.date))
        .range([0, width]);

    const y = d3.scaleLinear()
        .domain([0, d3.max(data, d => d.price)])
        .nice()
        .range([height, 0]);

    svg.append('g')
        .attr('transform', `translate(0, ${height})`)
        .call(d3.axisBottom(x));

    svg.append('g')
        .call(d3.axisLeft(y));

    svg.append('path')
        .datum(data)
        .attr('fill', 'none')
        .attr('stroke', 'steelblue')
        .attr('stroke-width', 1.5)
        .attr('d', d3.line()
            .x(d => x(d.date))
            .y(d => y(d.price))
        );
}
The first thing the function is doing is calling the fetchData() function, and then sets some styling for the chart.
Now, there’s a lot going on in this. We’re going to do our best to explain these methods and what’s happening, but we’ll leave it up to you to really explore the D3 documentation.
The first notable thing the code is doing is selecting the SVG element, via const svg = d3.select('svg'), appending an SVG g element (a group element) to it. This g element is then translated according to the margins defined earlier.
Next, we have const x = d3.scaleUtc(). .scaleUtc creates a time scale for the x-axis. To create a linear scale for the y-axis, we set const y = d3.scaleLinear(), which sets the domain to be from 0 to the maximum price value in the data, and maps it to the height of the chart.
svg.append('g') appends a group element for the x-axis to the SVG and calls d3.axisBottom(x) to create an x-axis using the scale x. We also call it again in the next line to append an element for the y-axis.
svg.append('path') does quite a bit more. It appends a path element to the SVG and binds the data to it using .datum(data). Then it sets attributes for the path such as fill, stroke, and stroke-width. Finally, it constructs the line using d3.line() and sets its x and y attributes using the scales x and y, respectively.
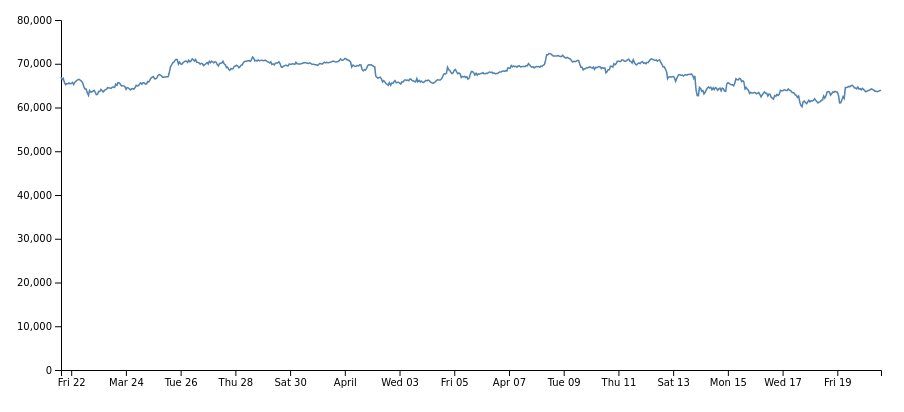
After running this, we should see the following chart in the browser:
Don’t stop here. Keep exploring the D3 library, and perhaps check out some of the examples of what people have built. You can check out the D3 gallery for some inspiration.
All of the code in this article is available on GitHub
Conclusion
This article barely scratched the surface of the capabilities of D3.js. Nonetheless, we hope it at least sparked some inspiration for you to explore this library more in depth yourself. There are a ton of highly impressive examples available online, including on D3’s Website.
Go check them out. And, please, if you create something with D3, share it with us! We would truly love that.
Happy Hacking!
Related Posts

Unveiling the Fascination of the Collatz Conjecture: Exploring Sequence Creation with JavaScript
The Collatz Conjecture, also known as the 3x+1 problem, is a fascinating mathematical puzzle that has intrigued mathematicians for decades. It has sparked publications with titles such as The Simplest Math Problem Could Be Unsolvable, or The Simple Math Problem We Still Can’t Solve because it is, indeed, rather simple-looking.
Read more
JavaScript’s Secret Weapon: Supercharge Your Web Apps with Web Workers
During an interview, I was asked how we could make JavaScript multi-threaded. I was stumped, and admitted I didn’t know… JavaScript is a single-threaded language.
Read more
Creating a NodeJS Budgeting Tool
In this article, we’re going to show you how to read and write to a .txt file using NodeJS by creating a small budgeting CLI (Command Line Interface).
Read more