JavaScript Libraries for Mathematical Computing: 5 Projects You Should Know About
Mathematical computing is an essential aspect of modern-day software development. From data analysis to machine learning, mathematical operations play a crucial role in almost every application. JavaScript libraries have emerged as a powerful tool for developers to perform complex mathematical operations with ease.
In this article, we’ll take a look at some of the most popular JavaScript libraries for mathematical computing.
1. Math.js
Math.js is a comprehensive JavaScript library that provides a broad range of mathematical functions and operators. It has an easy-to-use syntax that makes it suitable for both beginners and experts. The library includes support for complex numbers, matrices, units, and fractions, making it ideal for advanced mathematical operations. It also has a built-in parser that allows you to evaluate expressions and equations.
We can use the Math.js library to perform a simple mathematical operation in JavaScript:
// Import the Math.js library
const math = require("mathjs");

// Perform a basic arithmetic operation
const result = math.eval("2 + 3 * 4");

// Print the result to the console
console.log(result); // Output: 14
In this example, we first import the Math.js library using the require statement. We then use the math.eval method to evaluate a simple arithmetic expression (2 + 3 * 4) and store the result in the result variable. Finally, we print the result to the console using the console.log method.
Let’s take a look at another example of how to use the Math.js library to perform matrix operations:
// Import the Math.js library
const math = require("mathjs");

// Define two matrices
const A = math.matrix([
  [1, 2],
  [3, 4],
]);
const B = math.matrix([
  [5, 6],
  [7, 8],
]);

// Multiply the matrices
const C = math.multiply(A, B);

// Print the result to the console
console.log(C); // Output: Matrix [[19, 22], [43, 50]]
In this example, we first import the Math.js library using the require statement. We then define two matrices (A and B) using the math.matrix method. We then use the math.multiply method to multiply the matrices A and B together, and store the result in the C variable. Finally, we print the result to the console using the console.log method.
Math.js provides a wide range of mathematical functions and operators, including trigonometric functions, logarithms, complex numbers, and more. You can find the full documentation for Math.js on their website: https://mathjs.org/.
2. Numeral.js
Numeral.js is a lightweight JavaScript library that specializes in formatting and manipulating numbers. It provides a simple and intuitive syntax for working with numerical data. The library supports a variety of formatting options, including decimals, percentages, and currencies. It also includes advanced features like rounding and custom formatting.
Here’s an example of how to use the Numeral.js library in JavaScript to format numbers:
// Import the Numeral.js library
import numeral from "numeral";

// Define a number to format
const number = 1234567.89;

// Format the number as a currency
const formattedNumber = numeral(number).format("$0,0.00");

// Log the formatted number to the console
console.log(formattedNumber); // "$1,234,567.89"
In this example, we first import the Numeral.js library using the import statement. We then define a number to format, and use the numeral() function to create a Numeral.js object representing that number. We then use the format() method on that object to specify the format we want to use, which in this case is a currency format with two decimal places and thousands separators. Finally, we log the formatted number to the console.
We can also format numbers as percentage:
// Import the Numeral.js library
import numeral from "numeral";

// Define a number to format as a percentage
const number = 0.1234;

// Format the number as a percentage
const formattedNumber = numeral(number).format("0.00%");

// Log the formatted number to the console
console.log(formattedNumber); // "12.34%"
In this example, we define a decimal number 0.1234 and use the numeral() function to create a Numeral.js object representing that number. We then use the format() method to specify the format we want to use, which in this case is a percentage format with two decimal places. Finally, we log the formatted number to the console.
Note that Numeral.js supports many different types of number formatting, including percentages, decimals, and abbreviations. You can find more information on the Numeral.js documentation page: https://numeraljs.com/
3. D3.js
D3.js is a popular data visualization library that allows you to create stunning visual representations of data. The library includes a wide range of chart types, including line, bar, and scatter plots. It also supports interactive features like zooming and panning, making it an excellent tool for exploring data.
Here’s an example of using D3.js to create a basic bar chart:
<!DOCTYPE html>
<html>
  <head>
    <meta charset="utf-8" />
    <title>My Bar Chart</title>
    <script src="https://d3js.org/d3.v7.min.js"></script>
  </head>
  <body>
    <div id="chart"></div>
    <script>
      // Define the data for the chart
      const data = [5, 10, 15, 20, 25];

      // Define the SVG element for the chart
      const svg = d3
        .select("#chart")
        .append("svg")
        .attr("width", 500)
        .attr("height", 300);

      // Define the scales for the x and y axes
      const xScale = d3
        .scaleBand()
        .domain(data.map((d, i) => i))
        .range([0, 400])
        .paddingInner(0.1);

      const yScale = d3
        .scaleLinear()
        .domain([0, d3.max(data)])
        .range([0, 250]);

      // Add the bars to the chart
      svg
        .selectAll("rect")
        .data(data)
        .enter()
        .append("rect")
        .attr("x", (d, i) => xScale(i))
        .attr("y", (d) => 300 - yScale(d))
        .attr("width", xScale.bandwidth())
        .attr("height", (d) => yScale(d))
        .attr("fill", "steelblue");
    </script>
  </body>
</html>
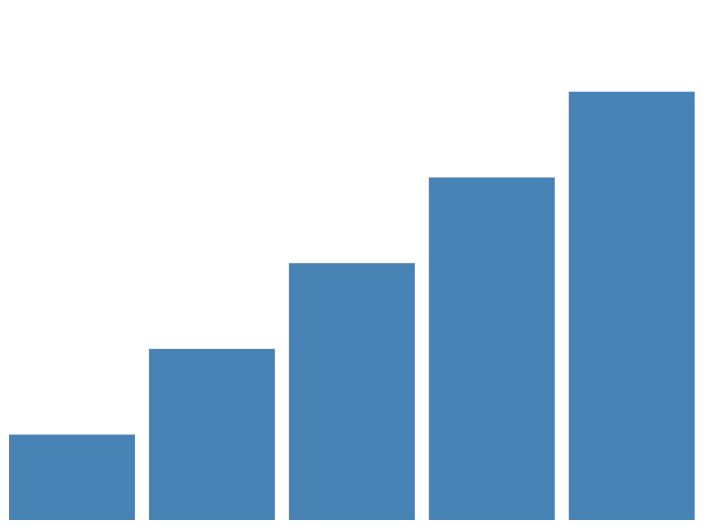
In this example, we first include the d3.js library by adding a script tag with the URL to the latest version of the library. We then define the data for the chart, which is an array of numbers. We create an SVG element for the chart using the d3.select() function to select the div with id chart. We set the width and height of the SVG element using the .attr() method.
We define the scales for the x and y axes using the d3.scaleBand() and d3.scaleLinear() functions, respectively. The xScale is a scale that maps each index of the data array to a position along the x-axis, while the yScale is a linear scale that maps the range of the data to the range of the y-axis.
We then use the selectAll() function to select all rect elements in the SVG element (which currently does not exist) and bind the data to the selection using the .data() method. We use the .enter() method to create new rect elements for each data point and append them to the SVG element using the .append() method. We set the attributes of the rect elements using the .attr() method, including the x and y position, width, height, and fill color.
Finally, we see the bar chart displayed in the browser, where each rectangle represents a value in the data array.
4. Chart.js
Chart.js is a powerful JavaScript library for creating beautiful and responsive charts. It includes support for a variety of chart types, including line, bar, and pie charts. The library is highly customizable, allowing you to customize every aspect of the chart’s appearance and behavior.
Here’s a quick example of using Chart.js (all within <body> tags):
<canvas id="myChart"></canvas>
<script>
  // Get the canvas element from the HTML code
  const ctx = document.getElementById("myChart").getContext("2d");

  // Define the data for the chart
  const data = {
    labels: ["January", "February", "March", "April", "May", "June", "July"],
    datasets: [
      {
        label: "Sales",
        data: [12, 19, 3, 5, 2, 3, 7],
        backgroundColor: [
          "rgba(255, 99, 132, 0.2)",
          "rgba(54, 162, 235, 0.2)",
          "rgba(255, 206, 86, 0.2)",
          "rgba(75, 192, 192, 0.2)",
          "rgba(153, 102, 255, 0.2)",
          "rgba(255, 159, 64, 0.2)",
          "rgba(255, 99, 132, 0.2)",
        ],
        borderColor: [
          "rgba(255, 99, 132, 1)",
          "rgba(54, 162, 235, 1)",
          "rgba(255, 206, 86, 1)",
          "rgba(75, 192, 192, 1)",
          "rgba(153, 102, 255, 1)",
          "rgba(255, 159, 64, 1)",
          "rgba(255, 99, 132, 1)",
        ],
        borderWidth: 1,
      },
    ],
  };

  // Create the chart
  const myChart = new Chart(ctx, {
    type: "bar",
    data: data,
    options: {
      scales: {
        yAxes: [
          {
            ticks: {
              beginAtZero: true,
            },
          },
        ],
      },
    },
  });
</script>
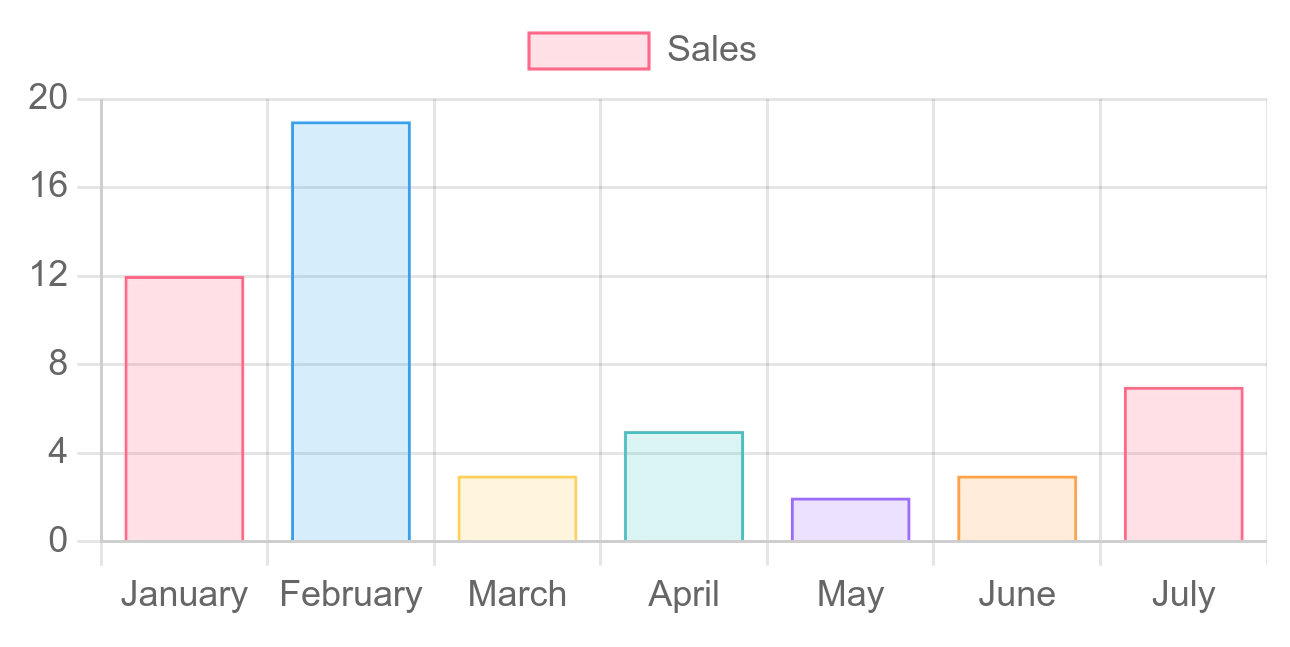
This will create a bar chart with the data provided and display it in the canvas element with the ID myChart. The chart will have a label for the sales data and display the sales for each month of the year. The colors for the bars will be automatically generated by Chart.js.
The above code should look like this:
5. MathJax
MathJax is a JavaScript library that allows you to display mathematical notation on web pages. It supports a wide range of mathematical symbols and notation, making it suitable for displaying complex equations and formulas. The library is easy to use and integrates seamlessly with other JavaScript libraries. We used MathJax in our Runtime Complexity Analysis article.
Conclusion
JavaScript libraries for mathematical computing have come a long way in recent years. They provide an excellent toolset for developers to perform complex mathematical operations and data visualization tasks with ease.
In this article, we’ve reviewed some of the most popular JavaScript libraries for mathematical computing. Whether you’re working with complex equations or creating stunning visualizations, these libraries will help you get the job done.
Questions or comments? Drop them down below.
Related Posts

The Art of Data Visualization: Exploring D3.js
Data is everywhere, flowing into our applications from various sources at an unprecedented rate. However, raw data alone holds little value unless it can be transformed into meaningful insights.
Read more
JavaScript’s Secret Weapon: Supercharge Your Web Apps with Web Workers
During an interview, I was asked how we could make JavaScript multi-threaded. I was stumped, and admitted I didn’t know… JavaScript is a single-threaded language.
Read more
Creating a NodeJS Budgeting Tool
In this article, we’re going to show you how to read and write to a .txt file using NodeJS by creating a small budgeting CLI (Command Line Interface).
Read more